Case study
Causal Inference of Wildfire Impact
Quantifying the "economic blast radius" of wildfire events by tying NIFC perimeters to SafeGraph visit streams, correcting for local shocks, seasonality, and staggered treatment timing.
Case study
Quantifying the "economic blast radius" of wildfire events by tying NIFC perimeters to SafeGraph visit streams, correcting for local shocks, seasonality, and staggered treatment timing.
Translate raw satellite perimeters and anonymized mobility data into actionable metrics that show how far, how quickly, and for how long business activity is depressed after a wildfire alarm.
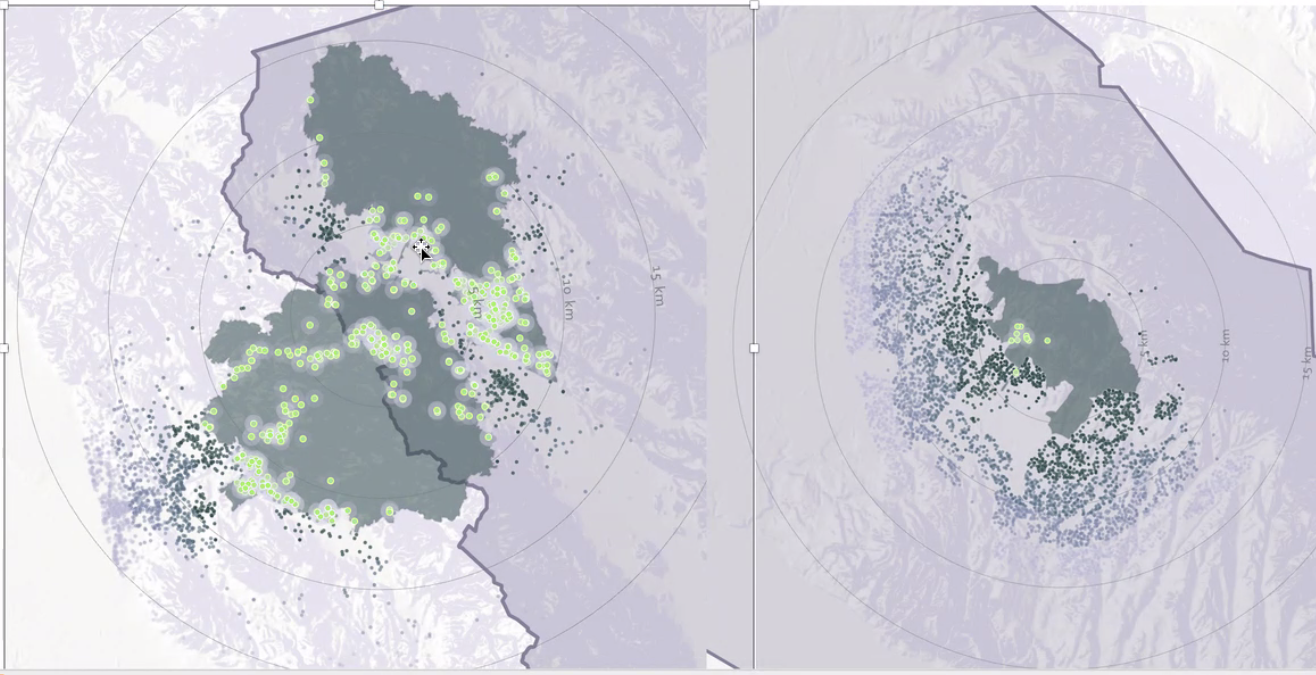
PostGIS and PySpark pipelines orchestrate raster-to-vector conversions, dissolve perimeters, and index concentric buffers (0–2/2–5/5–10/10–25 km). I matched 1.3M POI-week observations to the closest fire perimeter and fused NOAA drought, AQI, and census controls to guard against correlated shocks.
Estimated a Poisson Pseudo-Maximum Likelihood difference-in-differences with an event-study structure to absorb anticipation and persistence. Errors clustered by fire ID × DMA, and placebo alarms confirmed the design was well-behaved.
Results feed city planning dashboards that flag vulnerable commerce corridors and help insurance partners price business-interruption products with more granularity.